
Data
Last updated: 11 February 2013
| Update: New, 4-class labels of the BRATS training data is now available from the Virtual Skeleton Database. The detailed protocol used for manually segmenting these four classes is described in this PDF document. The corresponding test data and online evaluation scripts are currently being put in place. |
Training data
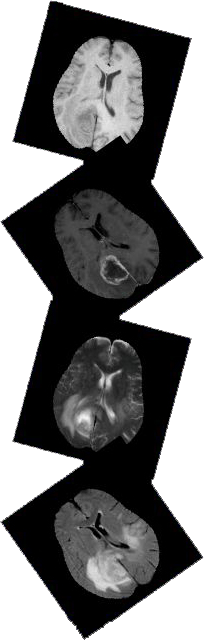
A publicly available set of training data can be downloaded for algorithmic tweaking and tuning, either from Kitware/MIDAS or from the Virtual Skeleton Database. The training data consists of multi-contrast MR scans of 30 glioma patients (both low-grade and high-grade, and both with and without resection) along with expert annotations for "active tumor" and "edema". For each patient, T1, T2, FLAIR, and post-Gadolinium T1 MR images are available. All volumes were linearly co-registered to the T1 contrast image, skull stripped, and interpolated to 1mm isotropic resolution. No attempt was made to put the individual patients in a common reference space.
The MR scans, as well as the corresponding reference segmentations, are distributed in the ITK- and VTK-compatible MetaIO file format. Patients with high- and low-grade gliomas have file names "BRATS_HG" and "BRATS_LG", respectively. All images are stored as signed 16-bit integers, but only positive values are used. The manual segmentations (file names ending in "_truth.mha") have only three intensity levels: 1 for edema, 2 for active tumor, and 0 for everything else. Detailed technical documentation on the used MetaIO file format is available here.
The training data also contains simulated images for 25 high-grade and 25 low-grade glioma subjects. These simulated images closely follow the conventions used for the real data, except that their file names start with "SimBRATS"; they are all in BrainWeb space; and their MR scans and ground truth segmentations are stored using unsigned 16 bit and unsigned 8 bit integers, respectively. Details on the simulation method are available here.
Testing data
A set of independent testing data will be provided on the day of the challenge itself. This testing data will be similar to the training data, except that the reference segmentation will not be made publicly available.
Data license
The BRATS training and testing data are made freely available through the Creative Commons Attribution-NonCommercial 3.0 license. Please include the following language in any work using the BRATS data:
| "Brain tumor image data used in this work were obtained from the MICCAI 2012 Challenge on Multimodal Brain Tumor Segmentation (http://www.imm.dtu.dk/projects/BRATS2012) organized by B. Menze, A. Jakab, S. Bauer, M. Reyes, M. Prastawa, and K. Van Leemput. The challenge database contains fully anonymized images from the following institutions: ETH Zurich, University of Bern, University of Debrecen, and University of Utah." |
Details on the manual segmentation protocol
The manual segmentations were performed in the XXX plane.<--> The following guidelines were used for the manual delineations of "active tumor" and "edema" from the real MR data:| High grade - active tumor (label 2) | |
| INCLUDED REGIONS | EXCLUDED REGIONS |
|
|
| Low grade - active tumor (label 2) | |
| INCLUDED REGIONS | EXCLUDED REGIONS |
|
|
| High and low grade - edema (same criteria; label 1) | |
| INCLUDED REGIONS | EXCLUDED REGIONS |
|
|